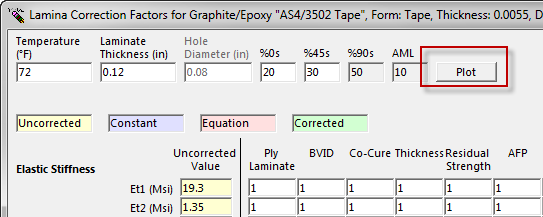
The corrected property values are plotted on the Lamina Correction Factor Plot form. To launch the Correction Factor Plot form, select Plot on the Lamina or Laminate Correction Factor form.
The corrected properties are displayed on the dependent Y-axis. The independent X-axis is selected to visualize the corrected property values with varying laminate thickness, ply percentage, temperature, and hole diameter.
The selection from the Orthotropic Material Property drop-down list identifies the corrected property values displayed in the plot.
The X-axis variable defines the independent variable on the corrected properties plot. Since lamina properties are temperature dependent, reference temperature is always available as an independent variable.
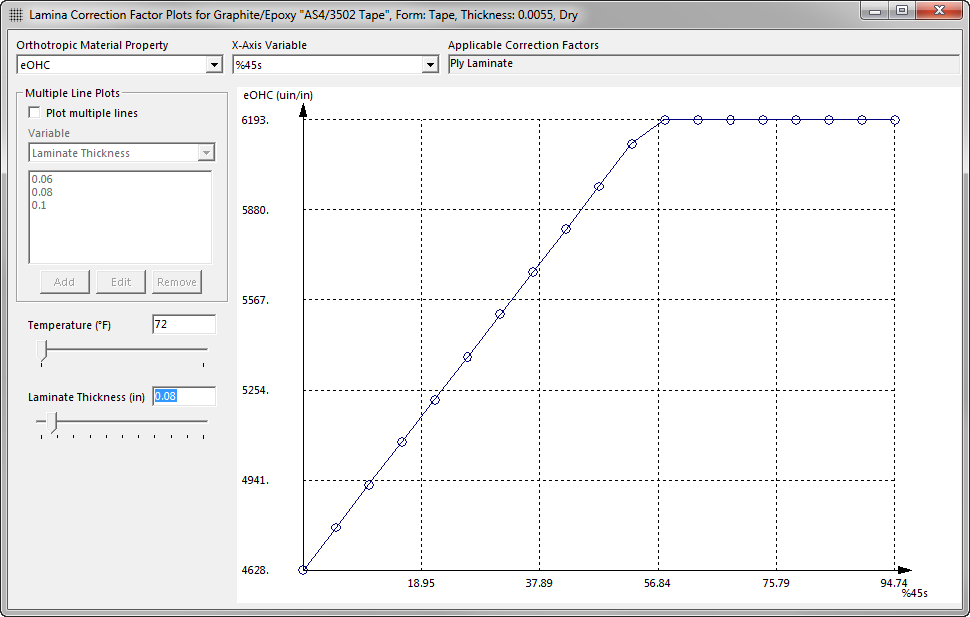
In the example above, the correction factors are defined as a function of %45's and laminate thickness. In this case each of the variables are available to be X-axis variables. Since the %45's are selected as the X-axis variable, the laminate thickness must be defined using the Laminate Thickness slider on the left side of the form.
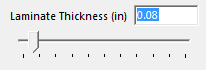
The slider defines the second independent variable and the corrected lamina properties are updated instantly.
Instead of discretely defining a second independent variable with the slider, multiple lines can be plotted simultaneously. In the example, multiple lines are displayed to represent different laminate thicknesses.
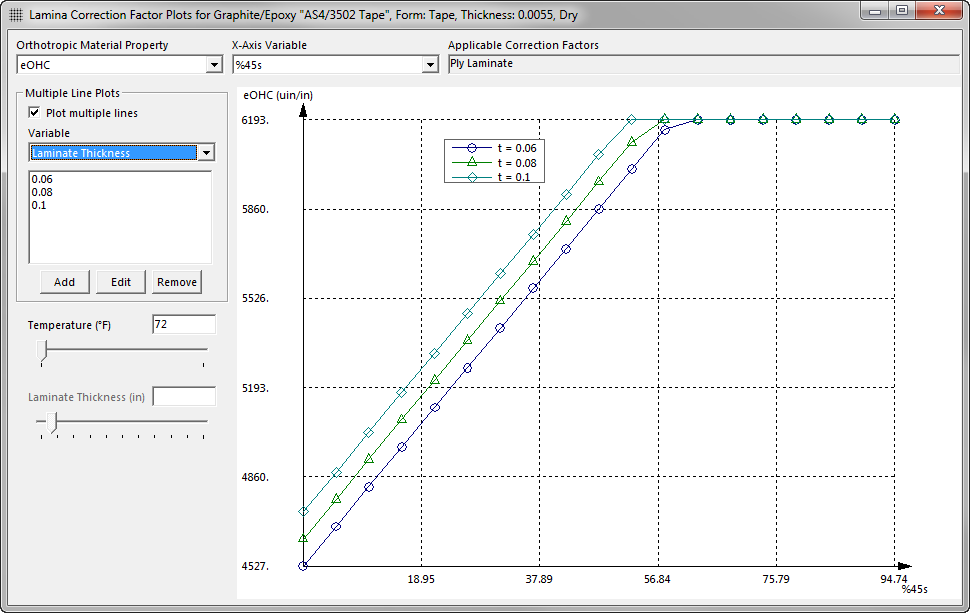
Select the Plot multiple lines check box to activate this feature. The laminate variable is selected from the Variable drop-down list. In the example, laminate thickness is selected.
Click Add to define a new laminate thickness data line.
Edit and Remove modify and delete lines from the plot.
![]()